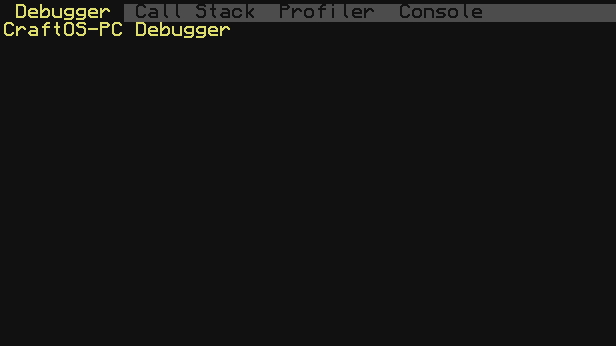
Debugger
CraftOS-PC v2.2 introduces a new debugger peripheral that allows in-depth examination of what's going on inside a program. Upon attaching the debugger, a new window will appear with the debugger interface.
Note that in CraftOS-PC v2.3 and later, the debugger will reduce the speed of the emulator due to some technical limitations of Lua. (In reality, it's actually that not having the debugger increases speed.) Emulation speed in CraftOS-PC v2.2.x is the same speed (slow) with or without the debugger.
Windows
The debugger has multiple windows that can show information about the process. It has a multishell-style tab bar at the top, allowing you to quickly switch between each window. You can also use Ctrl+Left/Right to switch between each tab.
Debugger
The Debugger window is the main window of the debugger. It has a GDB-style interface that allows stepping through lines, setting breakpoints, and examining the environment. You can trigger the debugger by holding Ctrl-T in the debugger, calling the stop() method of the peripheral, or calling debug.debug().
Local variables in the print command are available in the locals table. You can either search for a local by indexing with the local's name (e.g. p locals.myVar), or you can get a list of all locals available in a stack frame by indexing with the frame's ID (e.g. p locals[4]).
These are the available debugger commands as of v2.2:
- advance -- Run to a position in a file in the format
<file>:<line> - backtrace (bt) -- Show a traceback
- break (b) -- Set a breakpoint in the format
<file>:<line> - breakpoint set -- Set a breakpoint in the format
<file>:<line> - catch -- Set a breakpoint on special calls
- catch error -- Break on error
- catch load -- Break on loading APIs/require
- catch resume -- Break on resuming coroutine
- catch run -- Break on running a program
- catch yield -- Break on yielding coroutine
- clear -- Clear a breakpoint
- continue (c) -- Continue execution
- edit -- Edit the currently running program
- delete -- Clear a breakpoint
- delete catch error -- Stop breaking on error
- delete catch load -- Stop breaking on loading APIs/require
- delete catch run -- Stop breaking on running a program
- finish (fin) -- Step to the end of the current function
- info -- List info about the running program
- info breakpoints -- List all current breakpoints
- info frame -- List the status of the program
- info locals -- List all available locals
- print (p) -- Run an expression and print the result, similar to
lua.lua - step (s) -- Step a number of lines
Call Stack
The Call Stack window shows the path of the functions that ran from the start of the current coroutine to the running function. You can double-click or press enter on an entry to view where the code is currently being run. To return back to the main screen, click on the arrow in the top-left corner or press the left arrow key. You can also use the up/down arrow keys to browse the stack.
Profiler
The Profiler window is a basic profiler that shows run time and call counts for each function being run. Just click on the record button at the top or press enter, and the calls will start to be recorded. Press record again to stop recording. You can click on the column titles to change the sort order of the entries.
Console
The Console window shows any output that's been sent to the console via the print(text) method of the debugger peripheral.
Peripheral Methods
These methods can be called on the debugger peripheral in Lua.
- nil
debugger.stop(): Stops the computer and opens the debugger prompt. - number
debugger.setBreakpoint(string file, number line): Sets a breakpoint in a file at a line number.- file: The full file path to the script to stop on
- line: The line number to set the breakpoint at
- Returns: The ID of the new breakpoint
- nil
debugger.print(any value): Prints a value on the debugger's console window.- value: The value to print
Debug Adapter (VS Code)
CraftOS-PC v2.7 introduces a new debug adapter peripheral to be able to use debuggers like Visual Studio Code to debug.
To use it, install the CraftOS-PC extension for VS Code, and in the debugger tab in the sidebar, click the "create a launch.json file" link. This will prompt you to select a debugger type - click "CraftOS-PC Debugger".
A new launch.json file will appear with a basic configuration for the debugger. This configuration will launch a new instance of CraftOS-PC with the debugger connected. Launch path and arguments are controlled by the global extension settings.
If you wish to connect to an already running instance, you can change the request to "attach", which will instead look for a computer with a debug_adapter peripheral attached. By default, it tries to connect to computer ID 0, but if you're using another ID, add a "port" option with the ID of the computer + 12100. For example, to connect to computer 25:
{
    "type": "craftos-pc",
    "request": "attach",
    "name": "Debug CraftOS-PC",
    "port": 12125
}